When Victorian Scientists Drew the Colors of Numbers
Francis Galton collected early diagrams of private color and number experiences, creating strange visual records of synaesthesia and mental imagery.
Private experience made visible
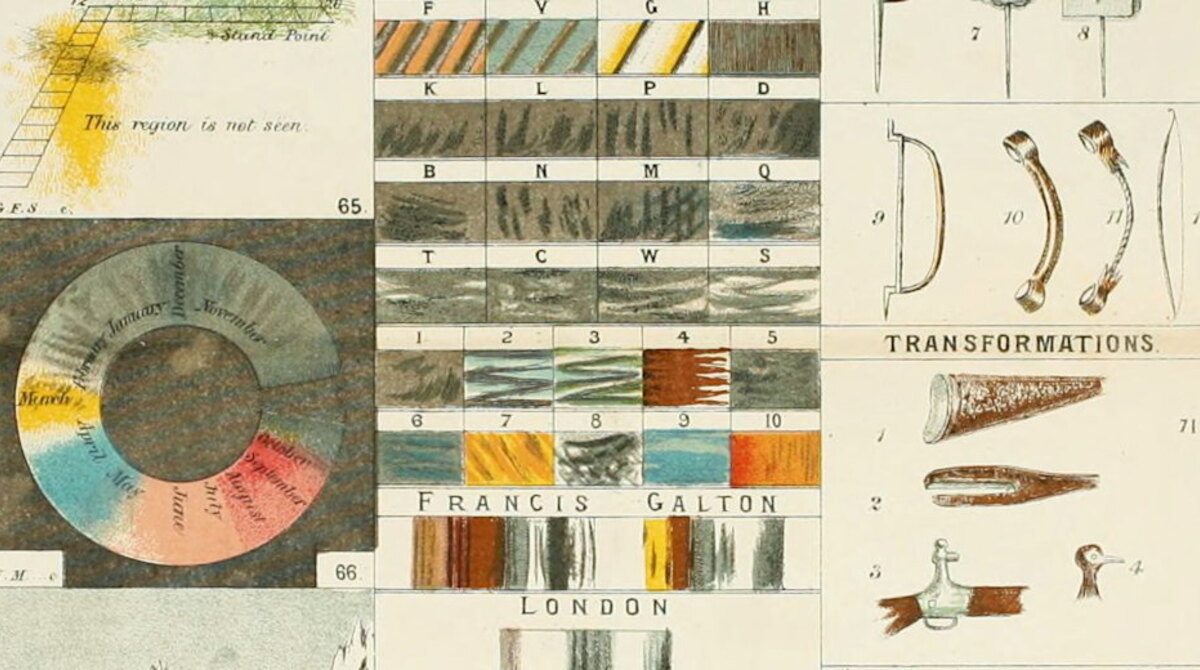
If the number 7 has a color in your mind, how would anyone else know? In the nineteenth century, researchers began collecting diagrams from people who experienced numbers, letters, or sounds with colors and spatial forms.
Francis Galton published an early color plate of these experiences in 1883. The diagrams are strange because they try to make private perception public: a map of something that exists only inside a mind.
The beauty and the baggage
The images are visually charming, but the historical context is not clean. Galton is also remembered for his central role in eugenics, a harmful movement built on false and coercive ideas about human worth.
That context should not be hidden. It is possible to look at the diagrams as documents in the history of psychology and visual culture while being clear about the damage attached to Galton's broader work.
Why the diagrams still feel modern
The diagrams still work because they show a problem that science, art, and design all share: how do you represent a subjective experience without flattening it?
They look like charts, but they are also tiny confessions. Someone was trying to show the color of a number, the bend of a mental calendar, or the shape of a sequence no one else could see.