
Satellites Power Down When They Cross This Patch of the Atlantic. It's a Dent in Earth's Magnetic Field, and It's Growing.
The South Atlantic Anomaly is a region where Earth's magnetic field is unusually weak, letting radiation dip closer to the surface. It has grown by nearly half the size of continental Europe since 2014, and a second weak lobe is spreading toward Africa. Satellites passing through it routinely power down instruments to avoid radiation damage. Here is what the anomaly is, why it is growing, and what it does and does not mean for the planet.
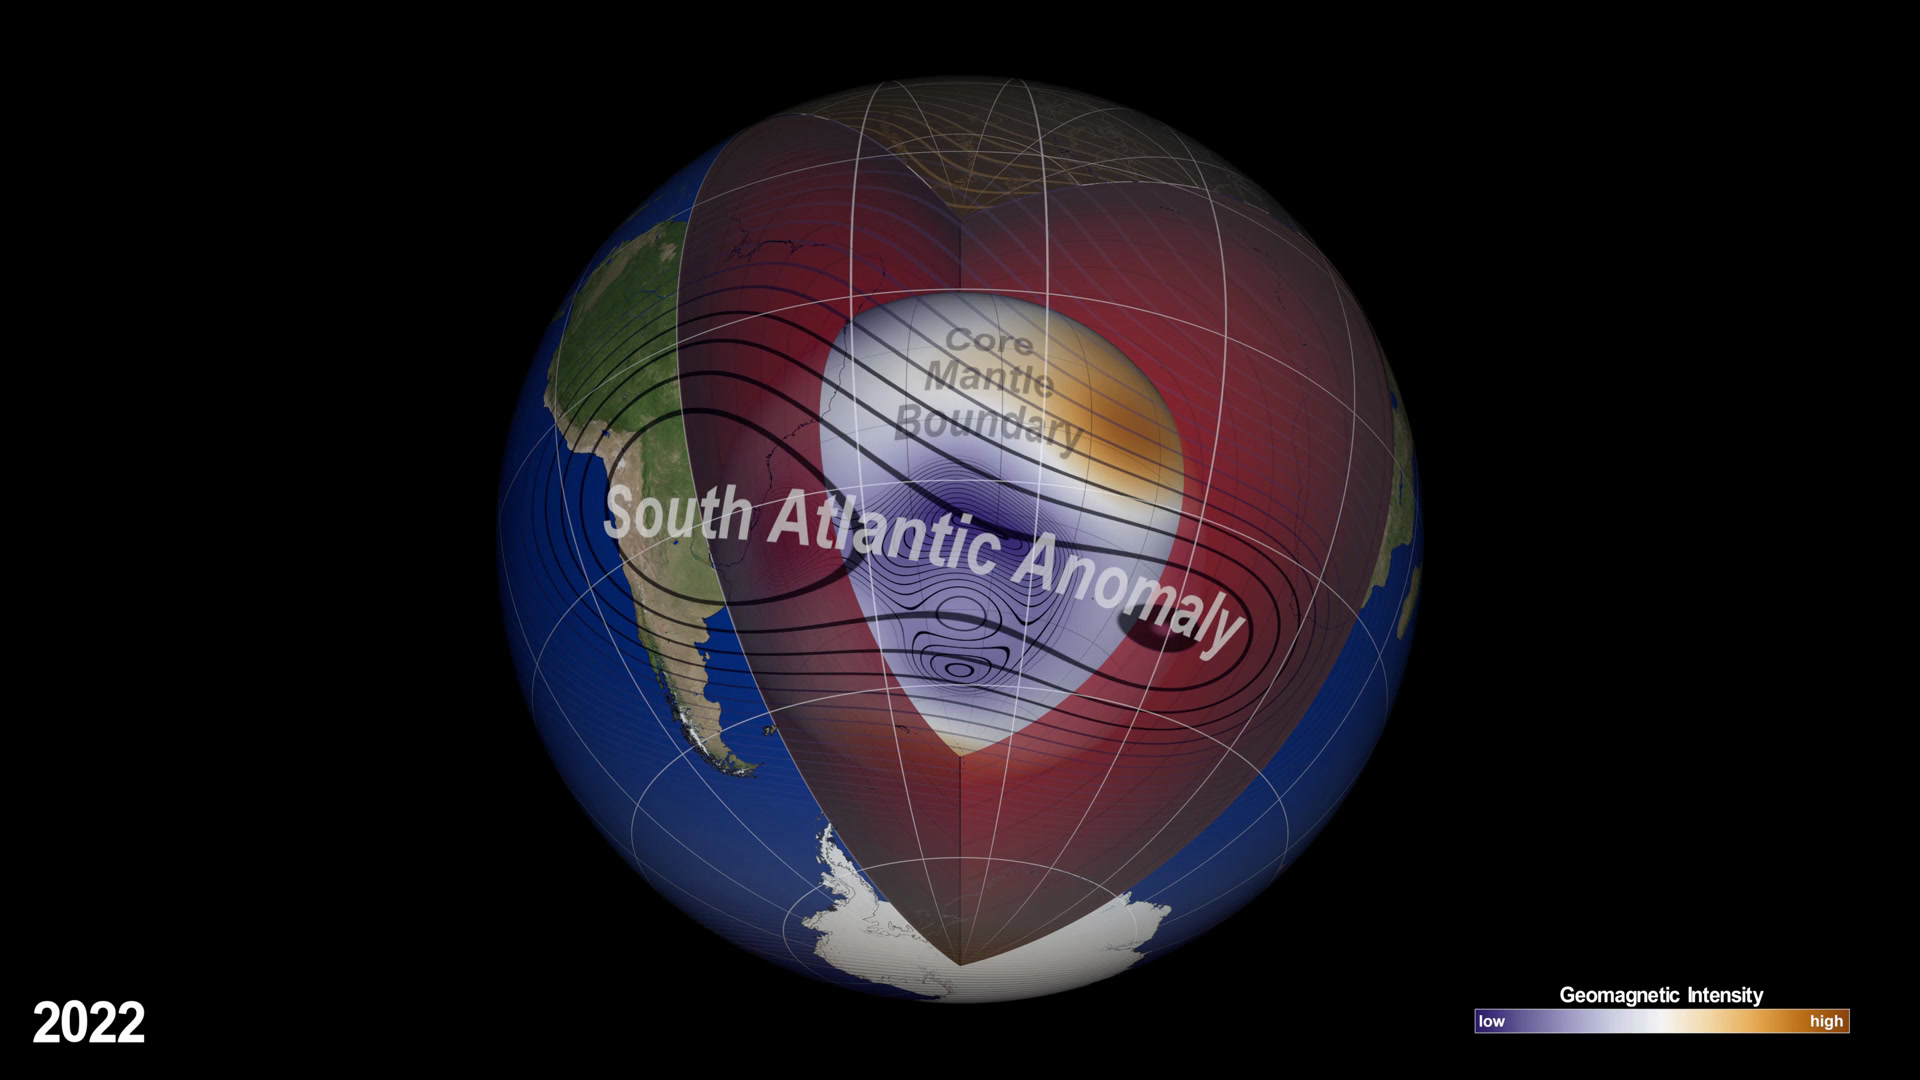
There is a patch of the sky over the South Atlantic where satellites routinely power their instruments down. It is not a no-fly zone and it is not a technical glitch. It is a dent in Earth's magnetic field, a region where the planet's invisible radiation shield sits closer to the ground, and every spacecraft in low Earth orbit crosses it several times a day.
The dent has a name: the South Atlantic Anomaly, or SAA. And it is getting bigger. According to a study analyzing 11 years of data from ESA's Swarm satellite trio, the anomaly has expanded since 2014 by an area nearly half the size of continental Europe. NOAA's 2025 World Magnetic Model annual report, released in January 2026, puts the most recent growth at eight percent in a single year, enough to worsen radiation damage to spacecraft and radio propagation problems. A second, faster-weakening lobe is now spreading toward Africa.
None of this is a reason to panic. The anomaly has no visible effect on life at the surface, and scientists are clear that a growing weak spot is not the same as a planet about to flip its poles. But it is a real, measurable change in the shield that makes Earth livable, and it matters to every satellite, astronaut, and navigation system on the planet.
What the South Atlantic Anomaly actually is
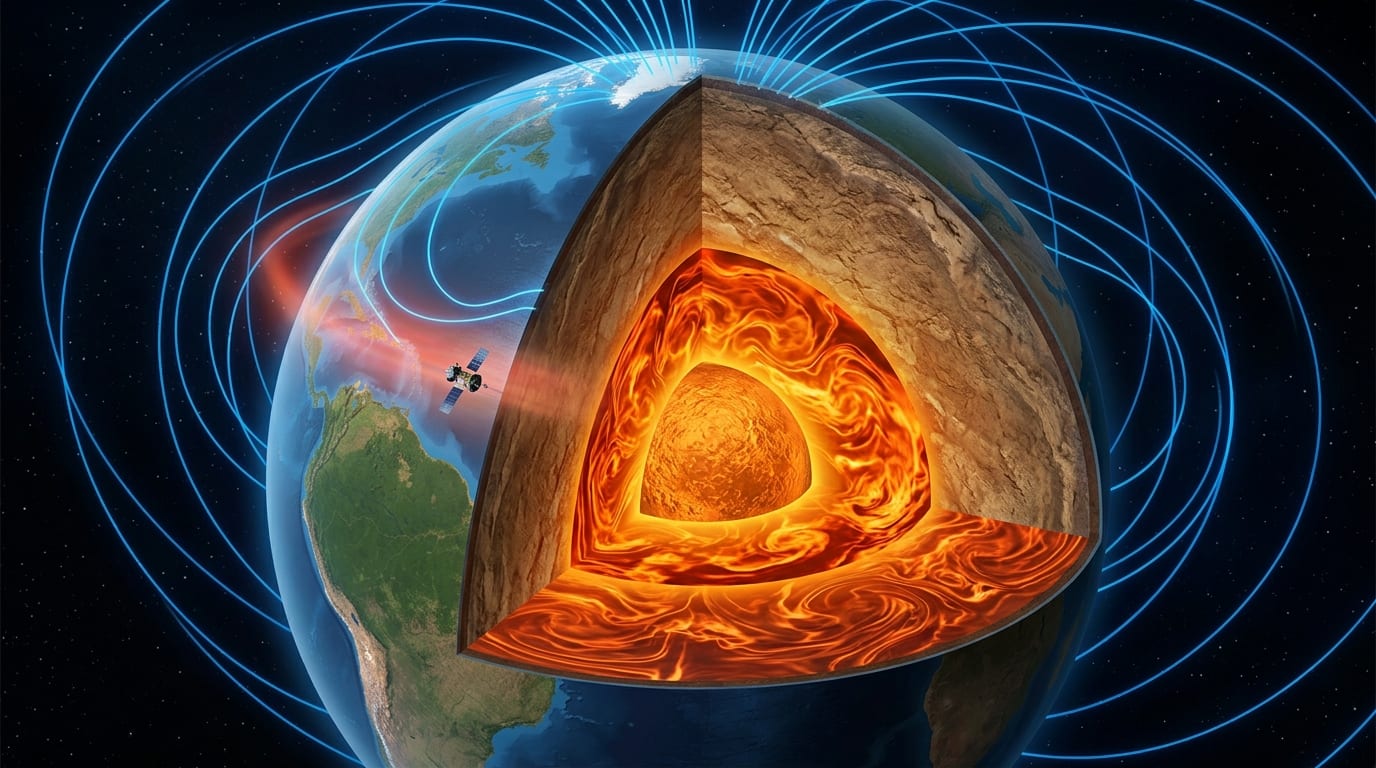
Earth's magnetic field is generated deep underground, about 3,000 kilometers down, in the churning liquid iron of the outer core. As this electrically conductive metal moves, it creates electric currents, which in turn generate the magnetic field that surrounds the planet. The process is called the geodynamo, and the field it produces acts like a giant bubble, deflecting charged particles streaming from the Sun and trapping others in the Van Allen radiation belts.
The field is not a perfect bar magnet. Its strength varies across the surface, and in one region it dips dramatically: over South America and the South Atlantic. There, the field intensity falls below 26,000 nanoteslas, compared with a typical global range of roughly 22,000 to 67,000 nanoteslas. For scale, a typical refrigerator magnet produces about 10 million nanoteslas. The SAA's weakest point now measures 22,094 nanoteslas, a drop of 336 nanoteslas since 2014.
Because the field is weak there, the Van Allen belts, the doughnut-shaped zones of trapped radiation around Earth, dip closer to the surface. Satellites passing through the region fly through more high-energy particles than anywhere else in low Earth orbit, and spacecraft like the Hubble Space Telescope routinely turn off their instruments before crossing it.
Why it is growing
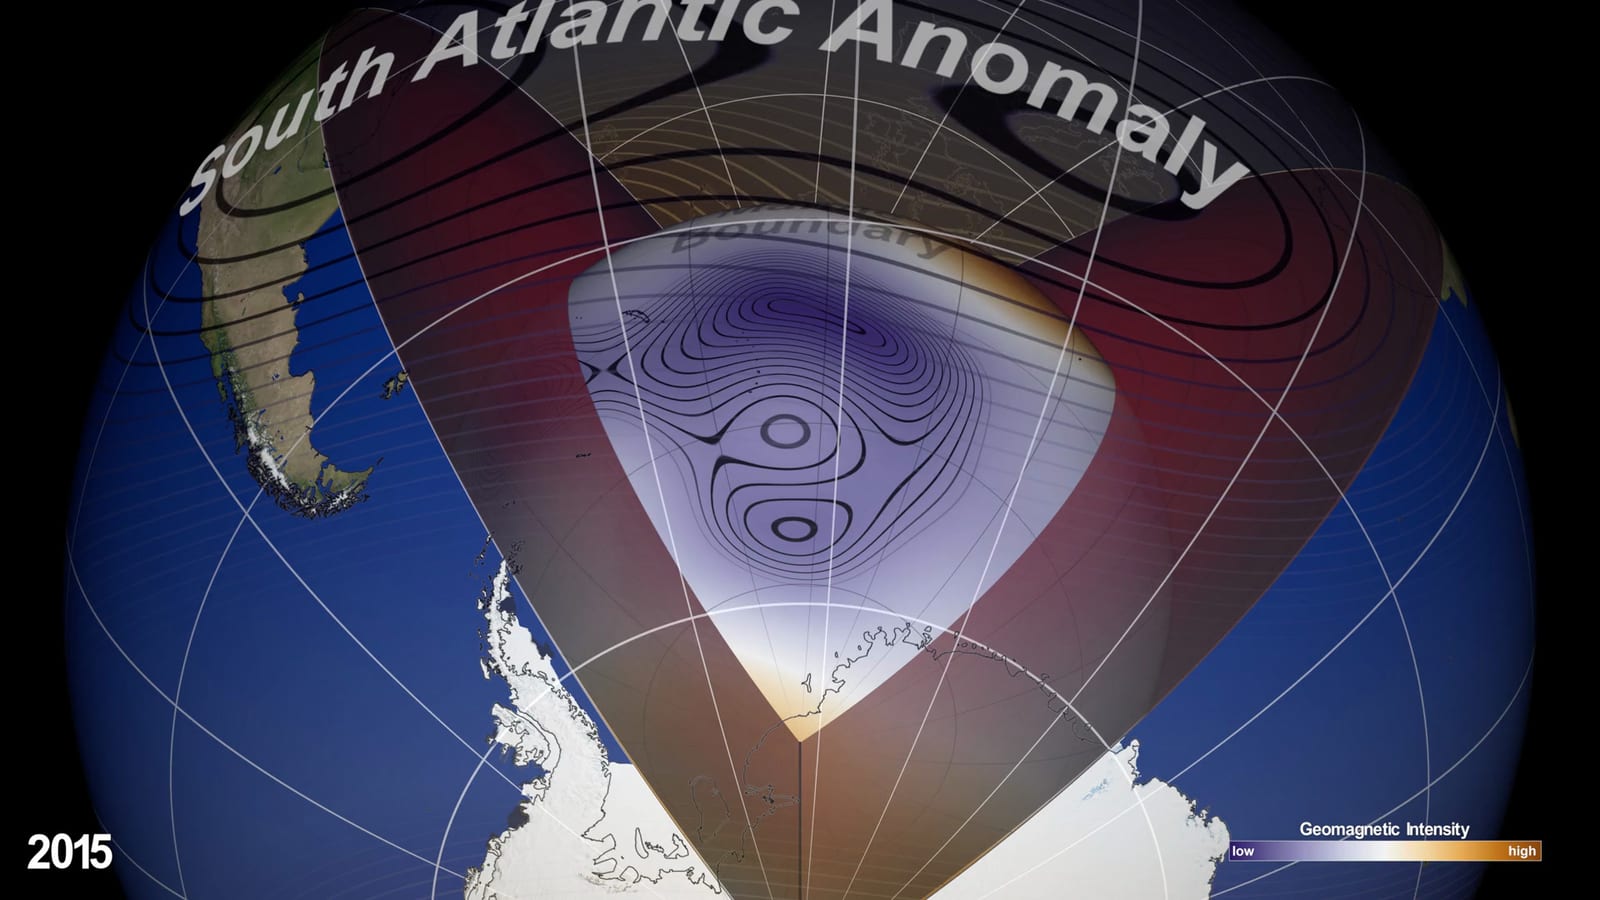
The growth is driven by something happening far below the surface. At the boundary between the liquid outer core and the solid mantle, the magnetic field has patches of reversed polarity, regions where the field lines point the wrong way. These are called reverse flux patches, and they are exactly what scientists see beneath the South Atlantic Anomaly.
"Normally we'd expect to see magnetic field lines coming out of the core in the southern hemisphere," Chris Finlay, a professor of geomagnetism at the Technical University of Denmark and lead author of the new study, said in ESA's announcement. "But beneath the South Atlantic Anomaly we see unexpected areas where the magnetic field, instead of coming out of the core, goes back into the core. Thanks to the Swarm data we can see one of these areas moving westward over Africa, which contributes to the weakening of the South Atlantic Anomaly in this region."
That westward-moving patch helps explain the second lobe. "The South Atlantic Anomaly is not just a single block," Finlay said. "It's changing differently towards Africa than it is near South America. There's something special happening in this region that is causing the field to weaken in a more intense way."
The changes are not limited to the weak spot. Since Swarm began operating, the strong-field region over Canada has shrunk by 0.65 percent of Earth's surface area, roughly the size of India, with its strongest point dropping 801 nanoteslas to 58,031. Meanwhile the strong-field region over Siberia has grown by 0.42 percent of Earth's surface, about the size of Greenland, with its maximum intensity rising 260 nanoteslas to 61,619. The northern magnetic pole, which navigation systems track closely, continues to drift toward Siberia at about 36 kilometers per year, nearly four times the southern pole's 9 kilometers per year.
How the dent is measured
The story of the SAA is really the story of two measurement systems, and it helps to keep them separate.
The first is the World Magnetic Model, a joint project of NOAA's National Centers for Environmental Information and the British Geological Survey. It is an engineering model, updated roughly every five years, that powers navigation in smartphones, aircraft, ships, and military systems. NOAA's annual reports track the model's accuracy and describe the state of the field, which is where the eight-percent growth figure comes from. When you read that the SAA grew eight percent in a year, that is NOAA's operational monitoring, not a peer-reviewed study.
The second is the Swarm mission itself. Launched on November 22, 2013, ESA's three identical Swarm satellites measure magnetic signals from the core, mantle, crust, and oceans, along with contributions from the ionosphere and magnetosphere. The mission now holds the longest continuous space-based record of Earth's magnetic field, and it is Swarm data, analyzed by Finlay and colleagues, that produced the study published in Physics of the Earth and Planetary Interiors in November 2025. The two systems agree: the anomaly is real, it is growing, and it is changing shape.
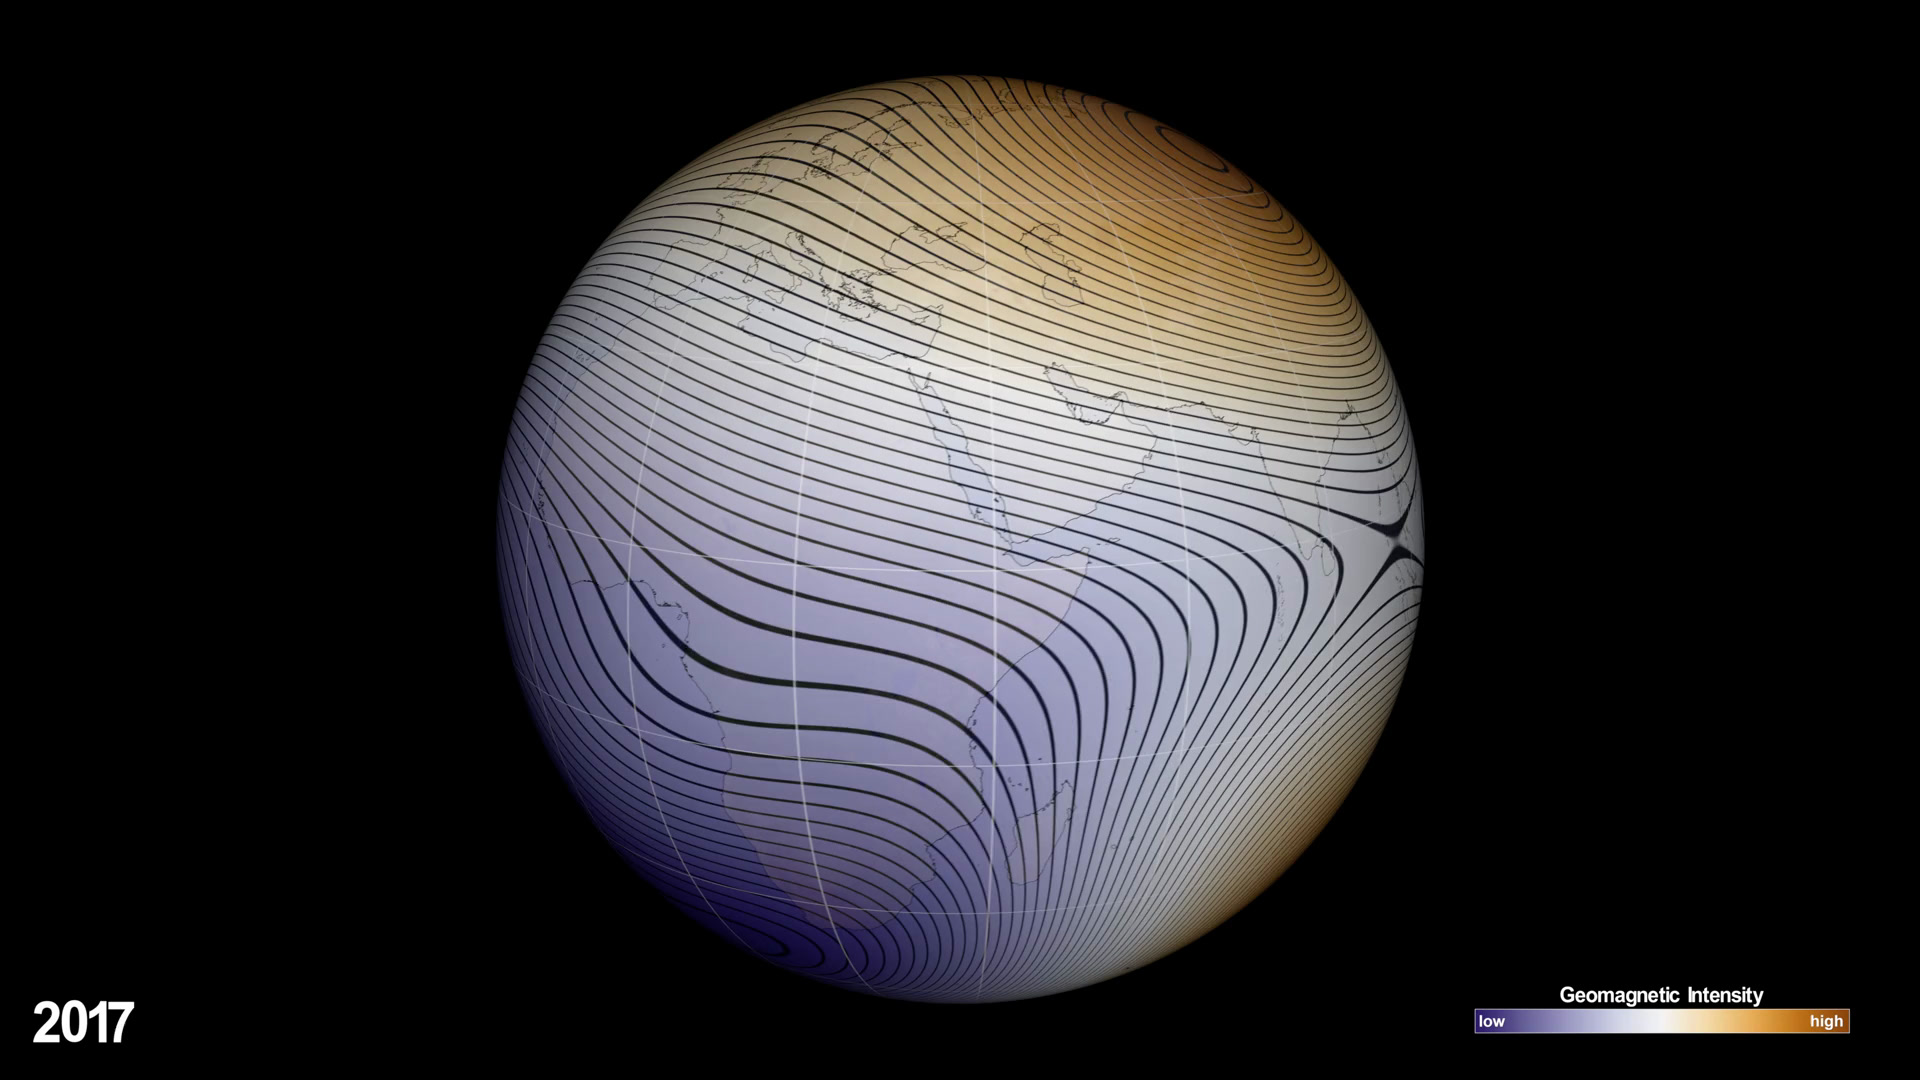
The Finlay study found that since 2014, the SAA's area has grown by almost one percent of Earth's surface. Since 2020, the region of the Atlantic southwest of Africa has been weakening even faster, which is where the second lobe comes from. The 2025 World Magnetic Model report confirmed the pattern, describing the deepening of the anomaly and its eight-percent expansion over the past year.
What the growth means for satellites and astronauts
The practical consequences are about radiation, and they fall hardest on hardware. "The main consequence is for our low-Earth-orbit satellite infrastructure," Finlay told Eos. "These satellites experience higher rates of charged particles when they pass through the weak field region, which can cause problems for the electronics."
Those problems range from corrupted data to full instrument shutdowns. Many satellites are designed to power down sensitive components during SAA crossings, a routine part of operations for missions like Hubble. As the anomaly grows, spacecraft pass through the radiation-heavy region more often and for longer stretches, which can shorten component lifespans and increase the need for radiation-hardened design.
Astronauts face a smaller but real risk. Crew on the International Space Station spend about six months in low Earth orbit on average, while satellites typically remain there for more than five years, roughly ten times as long. "Astronauts will also experience these charged particles, but their times in orbit are shorter than the lifetime of most low-Earth-orbit satellites," Finlay said. Still, the extra radiation exposure adds to a lifetime dose that mission planners track carefully.
There is no effect on the surface. The atmosphere absorbs the extra particles long before they reach the ground, which is why the SAA creates no visible impacts on daily life, a point NASA's own visualization notes. The anomaly is a space-weather feature, not a ground-level hazard.
Is the magnetic field about to flip?
This is the question the anomaly always raises, and the answer is: no one should read the growth as a countdown. The scientific consensus is that the SAA is a feature of a turbulent dynamo, not a sign that the poles are about to reverse.
"We know from paleomagnetic records that Earth's magnetic field has weakened many times in the past, displaying weak field regions like the South Atlantic Anomaly, without reversing," Finlay said. "We are more likely seeing a decade to century timescale fluctuation in the field."
Geomagnetic reversals are real. The field has flipped hundreds of times over Earth's history, and the last full reversal, the Brunhes-Matuyama transition, happened about 780,000 years ago. During a reversal the field can weaken dramatically, which is one reason the topic gets attention. But reversals unfold over thousands of years on irregular timescales, and a weak spot like the SAA, however large it grows, is not evidence that one is beginning. The study found no sign of an impending reversal.
What happens next
The anomaly will keep changing, and it will keep being measured. Swarm's satellites remain healthy and are expected to extend the magnetic record beyond 2030. NOAA and the BGS will release the next World Magnetic Model update, and each annual report will track whether the growth continues, stalls, or shifts direction.
For spacecraft designers, the message is practical: since the weakness is growing, satellites will experience radiation effects over a larger area, and future missions should be designed with that in mind. For everyone else, the anomaly is a reminder that Earth's magnetic field is not a static shell but a living, churning system, tied to the molten metal 3,000 kilometers beneath our feet. The same planet that keeps its magnetic north pole drifting toward Siberia keeps a dent over the South Atlantic, and the two are part of the same restless machine.
Sources
- Finlay, Kloss & Gillet, "Core field changes from eleven years of Swarm satellite observations," Physics of the Earth and Planetary Interiors 368 (2025), DOI 10.1016/j.pepi.2025.107447 - the peer-reviewed study analyzing 11 years of Swarm data on the growth of the anomaly and the changes in the strong-field regions over Canada and Siberia
- ESA: Swarm reveals growing weak spot in Earth's magnetic field - the mission announcement with Finlay's quotes on the reverse flux patch moving westward over Africa
- NOAA NCEI: 2025 WMM Annual Report is Released (January 2026) - the operational report describing the SAA's eight-percent growth over the past year, satellite radiation damage, radio propagation problems, and pole drift speeds
- ScienceDaily: A giant weak spot in Earth's magnetic field is now half the size of Europe - coverage of the Finlay study with details on the growth since 2014 and the accelerating weakening southwest of Africa
- Eos: A Weak Spot in Earth's Magnetic Field Is Going from Bad to Worse (November 2025) - reporting on the study with the nanotesla figures, the reversal question, and Finlay's quotes on satellite and astronaut exposure
- NASA Scientific Visualization Studio: South Atlantic Anomaly 2015 through 2025 - the public-domain animation showing the anomaly deepening and splitting into two cells; source of the hero and inline images
- Wikipedia: South Atlantic Anomaly - background on the region's history, satellite impacts, and Van Allen belt interaction
Hero and inline surface/split images: frames from NASA's Scientific Visualization Studio animation "South Atlantic Anomaly: 2015 through 2025" (credit NASA's Scientific Visualization Studio; NASA imagery is generally in the public domain). Geodynamo diagram: generated illustration by the Impossible Universe Editorial Team. The ESA release and NOAA report links are cited for completeness; the ESA page can block automated readers but works in a normal browser. This article describes peer-reviewed research published in Physics of the Earth and Planetary Interiors in November 2025, with NOAA's World Magnetic Model reporting from January 2026.
Related on Impossible Universe
- NASA's MAVEN Spacecraft Went Silent Over Mars. It Left Behind 11 Years of Discoveries. - Mars lost its global magnetic field long ago; Earth's is weakening. A direct comparison between the two planets
- The Sun Has a Hidden Switch-Off Signal That Can Predict the Next Solar Cycle Years in Advance - the solar cycle drives the space weather that the magnetic field deflects
- For 100 Years, Scientists Could Not Explain Where Cosmic Rays Come From. Juno Just Watched Them Form. - how planetary magnetic fields accelerate the high-energy particles that radiation belts trap
- The Boulders That Remember Earthquakes - more from the earth-science beat, where the planet's deep dynamics shape what happens at the surface