The Sun Has a Hidden Switch-Off Signal That Can Predict the Next Solar Cycle Years in Advance
Scientists discovered that the Sun's most extreme space weather does not fade away gradually. It switches off suddenly at a specific point in every solar cycle, and the number of sunspots at that moment predicts how active the next cycle will be up to seven years before it peaks.
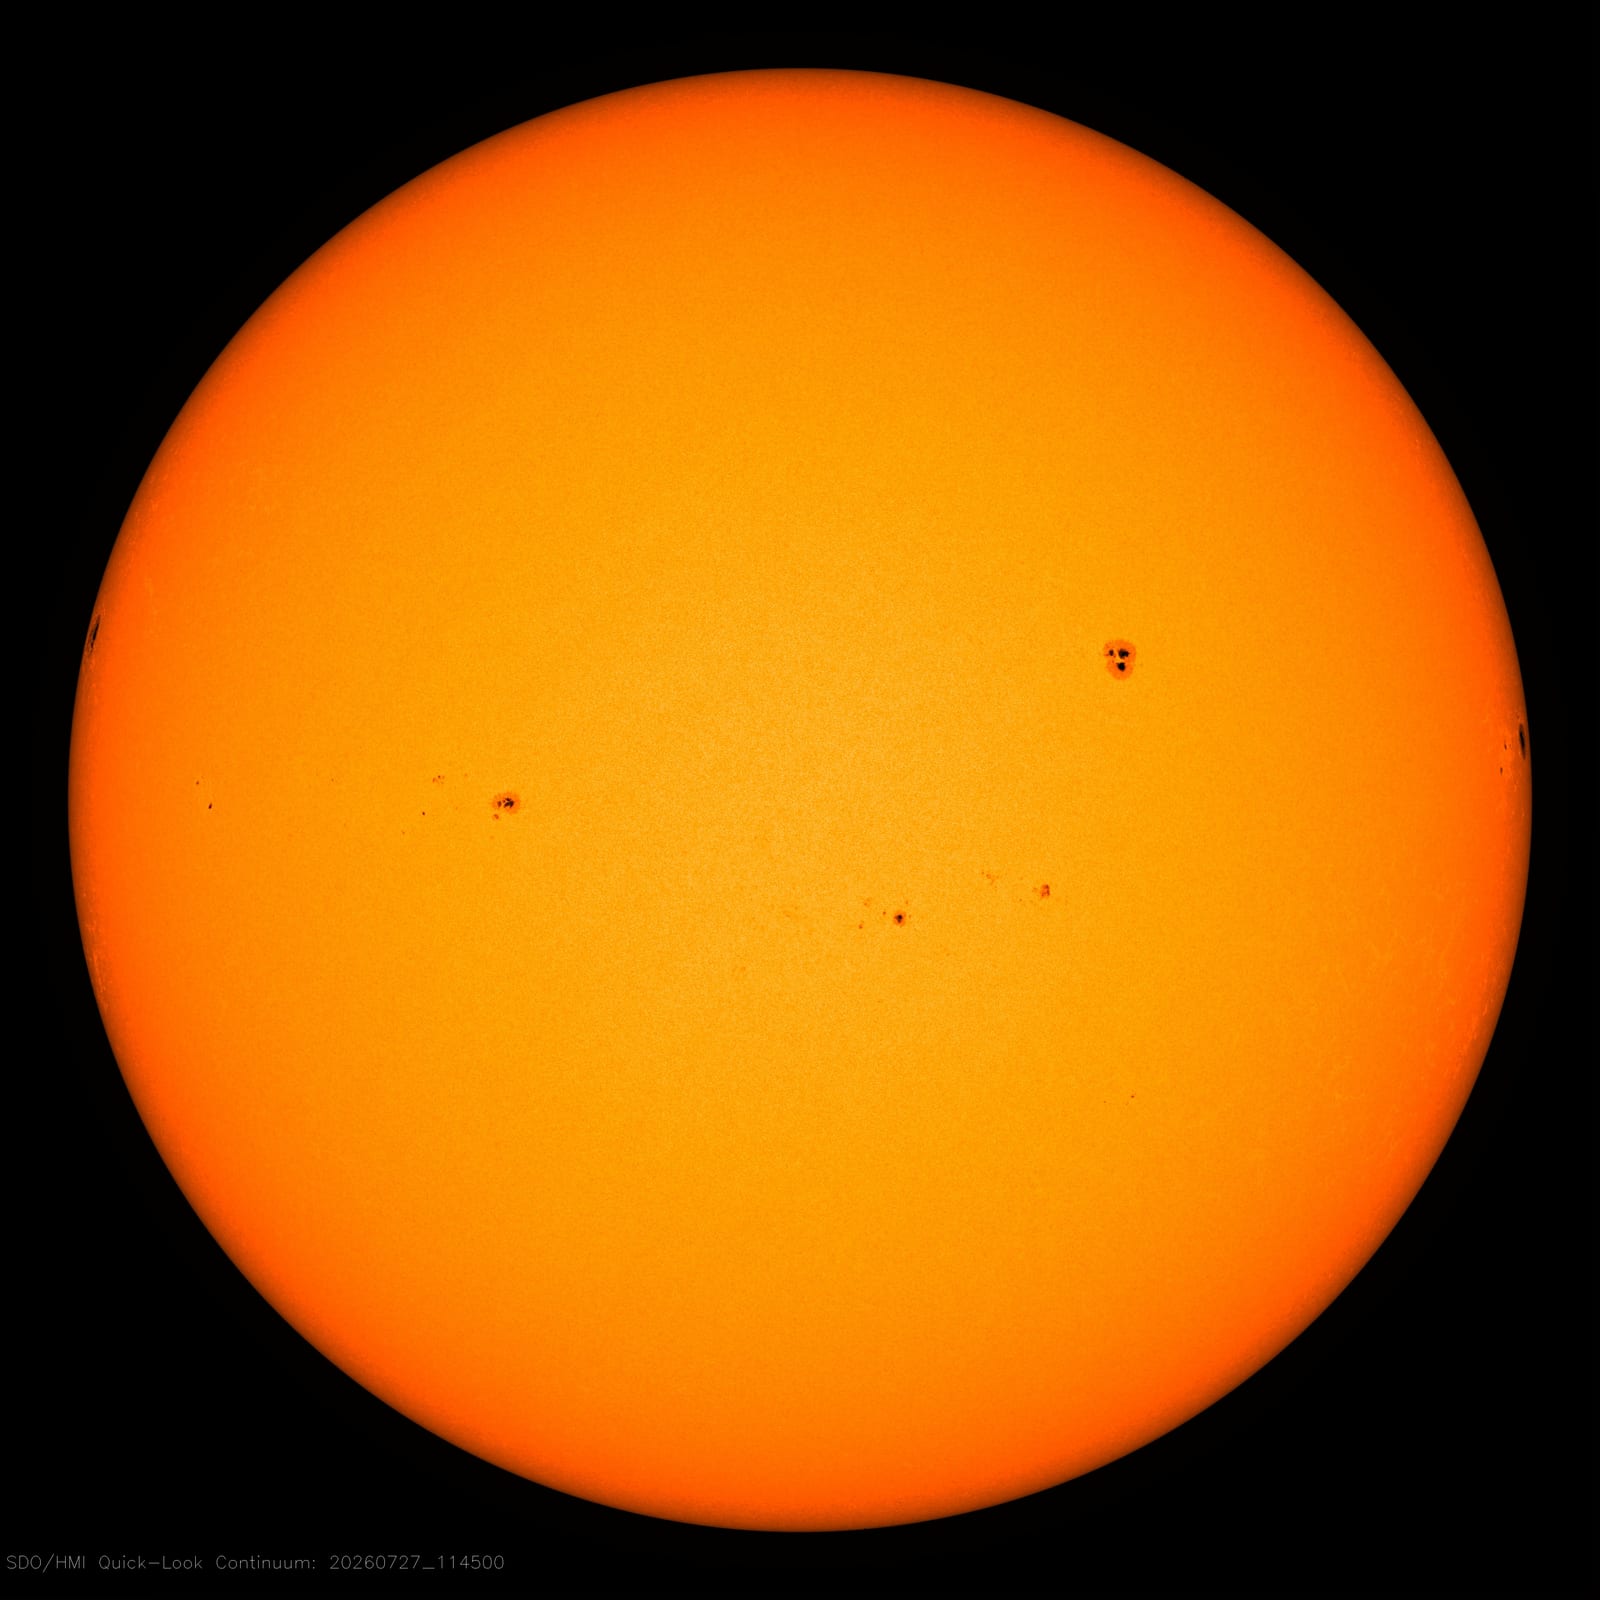
The Sun does not gently drift off to sleep. When its most dangerous space weather ends, it stops abruptly, like a switch being thrown. A team at the University of Warwick has identified exactly when that happens, and the discovery gives us a way to predict the strength of the next solar cycle up to seven years before it peaks.
Sandra Chapman, Professor of Physics and Director of the Centre for Fusion, Space and Astrophysics at the University of Warwick, presented the findings on July 20, 2026 at the Royal Astronomical Society's National Astronomy Meeting in Birmingham.
For years, Chapman has been mapping the Sun's irregular activity cycles onto what she calls a "sunclock," a way of standardizing each messy 11-year cycle so they can be compared to each other. The sunclock revealed something that was hiding in plain sight: in every cycle, the most extreme space weather events, the kind that produce vivid aurora and threaten power grids, do not gradually taper off. They vanish at a specific moment.
"The Sun doesn't gently go to sleep and then gently wake up again," Chapman said. "Instead, we've discovered that the most extreme space weather switches off quite suddenly at a specific point in every solar cycle."
The 15-degree line
Chapman's team traced the switch-off to a physical mechanism. Sunspots do not appear randomly across the Sun's surface. Over each 11-year cycle, they trace a "butterfly pattern," starting at high latitudes around 30 to 40 degrees north and south, then migrating steadily toward the solar equator as the cycle progresses.
When active sunspot regions cross below about 15 degrees of solar latitude, something changes. The Sun does not rotate as a solid sphere. Its equator spins faster than its poles, a phenomenon called differential rotation. That difference in rotation speed between latitudes is what twists up magnetic fields, stores energy, and ultimately drives the coronal mass ejections that cause the most extreme space weather.
Below 15 degrees latitude, differential rotation weakens dramatically. A co-rotating band forms near the solar equator, sometimes called the solar jet stream. At that point, the mechanism that winds up the magnetic field loses power. Chapman calls this the switch-off.

To verify the mechanism, Chapman examined 27-day correlations in the aa index, a long-running measure of geomagnetic activity at Earth going back to 1868. Before the switch-off, extreme storms were driven by coronal mass ejections with varied timing. After the switch-off, the remaining storms followed a clear 27-day pattern, meaning they came from co-rotating streams in the solar wind rather than from explosive ejections. The dangerous stuff really had switched off, and what was left was a calmer, more predictable sun.
Predicting the next cycle
The switch-off point is not just a curiosity about solar physics. It is also a predictor. Chapman's team found that the number of sunspots present when the switch-off happens is closely linked to the peak number of sunspots in the following solar cycle. More sunspots at switch-off mean a stronger cycle to come.
Current methods for predicting the next solar cycle rely on waiting until solar minimum, the point when sunspot numbers hit their absolute lowest. By that time, you have maybe two to three years of lead time before the next maximum. Chapman's method, if it works as demonstrated, would give six to seven years.
Using the switch-off approach, the team has made a very early projection for Solar Cycle 26: a moderate cycle with a sunspot number around 100 to 120. That would make it similar to, or slightly weaker than, the current Solar Cycle 25. But Chapman is clear that this is a preliminary projection. The actual switch-off point for Cycle 25 has not arrived yet.
"We're about two years away from the switch-off point for the current Solar Cycle 25," Chapman said. "At the moment, we have to estimate where that point will be, but once we reach it we can use observations alone to make a much more precise prediction for Solar Cycle 26. That will still give us around seven years' warning of how strong the cycle is likely to be."
Why the forecast matters
Solar cycle predictions are not just an academic exercise. Strong solar cycles mean more space weather, and more space weather means more risk to satellites, GPS, aviation, power grids, and communications systems. The May 2024 geomagnetic storms during Solar Cycle 25's maximum produced aurora visible as far south as Devon and Cornwall in the UK. A stronger Cycle 26 would bring more such events, potentially with real economic consequences.
The method has already earned credibility by predicting that Solar Cycle 25 would be stronger than many consensus forecasts. When Chapman applied the switch-off approach retrospectively to earlier cycles, it outperformed standard prediction methods that relied on the solar minimum as a precursor. Cycle 25's stronger-than-expected maximum, and its dramatic aurora displays, validated the claim.
"The new method also identifies a specific stage in the solar cycle when the magnetic field that drives the next cycle should become established," Chapman said. The team hopes this will improve understanding of the solar dynamo, the process deep inside the Sun that generates its magnetic field. That process is still not fully understood, and reliable cycle prediction has been an open problem in solar physics for more than a century.
A new precursor for an old problem
Solar cycle prediction has a long and occasionally humbling history. Galileo recorded sunspots in the early 1600s. Samuel Heinrich Schwabe first noticed the 11-year periodicity in 1843. Rudolf Wolf formalized the sunspot number system in 1848, and it remains the standard metric today. But predicting how active the next cycle will be has always been difficult. Physical models of the solar dynamo are improving, but statistical methods based on precursor observations still dominate operational forecasting.
Chapman's switch-off precursor is a new tool in that statistical tradition, but one grounded in a physical mechanism: the shutdown of the differential rotation engine when sunspot zones reach the co-rotating band below 15 degrees. If the switch-off forecast for Cycle 26 holds when real observations replace the current estimate in roughly 2028, it would become one of the longest-lead-time prediction methods available.
The Sun has not finished telling us about Cycle 25 yet. There are roughly two more years of activity before the switch-off arrives, and during that time the cycle could still produce surprises. But when the switch-off comes, it will be sudden. And when it does, the Sun will already have left a clue about what comes next.
Sources
- Royal Astronomical Society: "NAM 2026: How Sun goes to 'sleep' could reveal space weather when it wakes" - primary press release with researcher quotes and sunclock figures
- Phys.org: "How the sun goes to 'sleep' could reveal future space weather when it wakes" - detailed coverage with sunclock imagery
- Discover Magazine: "A New Solar 'Switch-Off' Signal Could Help Predict Future Space Weather" - independent reporting including Cycle 26 prediction details
- NAM 2026, University of Birmingham (July 20-24, 2026) - conference program and block schedule
- Wikipedia: Solar Cycle - background on solar cycle dynamics, sunspot numbers, the butterfly diagram, and prediction methods
- NASA SVS: SDO 4K Slow-Rotation Sun Resource Page - Solar Dynamics Observatory imagery, public domain
Hero image: NASA/SDO HMI visible-light image of the Sun, public domain. Sunclock/switch-off explanatory diagram generated for Impossible Universe based on Chapman et al. research presented at NAM 2026.
Related on Impossible Universe
- Will Earth Survive the Sun Becoming a Red Giant? New Research Says Maybe - what the Sun's future evolution means for our planet
- New Horizons Heads for the Solar System's Edge. Forecasts Predict When It Will Cross the Boundary. - another story about predicting where boundaries lie
- Scientists Created the First Time Crystal You Can Actually See With Your Own Eyes - periodic systems that behave in surprising ways
- NASA MAVEN Mission Ends After 11 Years at Mars - how space weather from the Sun shapes planetary atmospheres